Gramener augments human intelligence by extracting insights from heterogeneous data sources and converting them into memorable stories for decision making
Recent reports have highlighted the alarming rate at which species are being categorised as endangered. India has high-profile cases of endangered species like the Bengal tiger, Asiatic lion or the red panda. This environmental crisis requires cutting-edge solutions that can track and help combat the loss of biodiversity.
New-age technologies such as Artificial Intelligence and Machine Learning have the potential to find solutions to problems such as these.
Data science company Gramener could probably help in this regard.
This Singapore- and US-based firm has created a deep learning AI application that, for example, can track salmon and fish populations over time in order to detect changes in the habits and decline of the salmon species — making what used to be a labour-intensive effort into an automated tool.
“Our purpose is to augment human intelligence by extracting insights from heterogeneous data sources and converting them into memorable stories for decision making,” Gramener Co-founder S. Anand tells e27. “We help organisations and clients analyse data and consume insights. We build custom Big Data analytics and visualisations on our platform and bring expertise to data, design and business.”
Gramener was founded in 2010 by Anand (CEO), Naveen Gattu (COO), Mayank Kapur ( CDO) and Ganes Kesari (SVP– Analytics & AI Labs).
“Data generation and analytics are not sufficient for making decisions. Automated insights and narrative stories not only help you consume data easily and consistently, but also help cross the analytics chasm. Humans don’t understand data or models innately. Design principles derived from an understanding of human perception help visualise these and absorb their implications subliminally,” Anand observes.
Also Read: Is data science still among the sexiest jobs of the 21st century?
In addition to helping organisations and government agencies to address pressing environmental issues, Gramener’s products are also used by companies across various other sectors for various purposes, including:
Financial services: Offers a suite of data visualisation and analytics solutions for retail banks, corporate banks, investment banks, asset management, insurance and regulatory bodies.
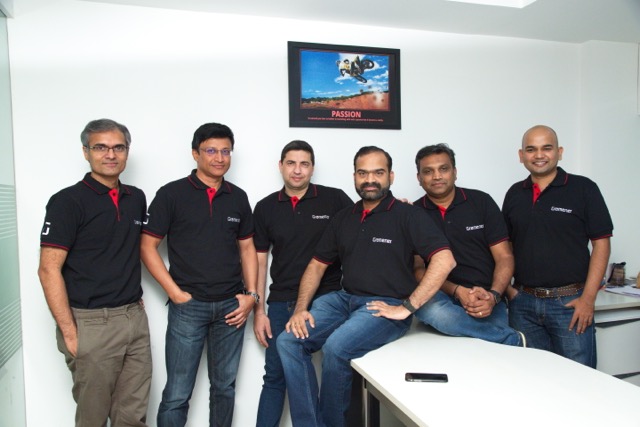
The Gramener team
Retail and consumer goods: Offers retailers, malls, consumer goods and product companies visual analytics for in-store insights, product and channel performance, as well as optimizing supply chain performance.
Healthcare: Helps pharmaceutical companies, hospitals, clinics and healthcare providers visualise sales performance, improve the service operations, and communicate better with customers and channels.
Agriculture: Helps agricultural, commodity and food organisations analyse and visualise data on their purchases, identify factors driving productivity, and forecast prices for improved inventory management.
Marketing: Helps marketing teams understand customer behaviour, uses this to segment customers based on their actions, and recommends product, pricing, or promotions for each closely defined segment
HR: Offers solutions for corporates to improve their talent recruitment, performance improvement and attrition defense – using text analysis, Machine Learning, data visualisation and narratives.
Media: Partners with various media organisations for digital content and data journalism, data-driven market research, communication through infographics and consumer insights via advanced analytics and visualisation (In the Assembly elections in India in 2018, the company worked with a leading TV news channel for election analytics).
“A leading print media organisation approached us for a solution that could automatically tag the three million images it hosts with the people (faces), objects and texts present in the images. We worked with them, and now it has a scalable web service that lets users upload images and accurately recognise people, objects and texts in the images within seconds,” he shares.
The company has also worked with ‘Microsoft AI for Earth’ and ‘Nisqually River Foundation’ to automate identification of fish species. Gramener’s solution processed the video feed from the cameras, extracted images, and classified the type of fish based on a pre-trained neutral algorithm. The interface allows biologists and non-technical users to interact with ease.
“Our products are deployed in critical business functions in Fortune 500 enterprises, government and non-profit organisations across the world to solve complex business problems and enable business users towards data-driven leadership,” shares Anand, himself a data scientist and a Gold Medalist from IIM Bangalore.
Anand reads three key trends in the market — data visualisation, cognitive research and business-driven analytics. “Data visualisation is no longer in the realm of pure numbers. Text analysis is relatively mature and is being applied routinely to various problems. Even a pure text corpus like The Mahabharata (Hindu mythology) can be visualised. Images, audio and video are rapidly becoming analysable and visual sable.
Secondly, cognitive research. What we know of the human eye and brain is increasingly making its way into practical visualisations. For example, most men can name only 11 colours (women can name about 15), but can differentiate between over a million colours when placed next to each other. So, while a heatmap that places regions adjacently can be coloured with millions of shades, a bubble chart should have 11 colours at most. Such rules of thumb and now baked into the software people build for data visualization these days.
Thirdly, business-driven analytics. Analytics is shifting more towards business users or consumer driven, this has been the evolution,” he explains.
But data science business is a challenging industry. Visual analytics requires a combination of statistics, programming and design. Finding good people with one of these talents is hard. The combination is near impossible.
“Another challenge is the longer sales cycle. Almost every person on the business side understands the value of analytics instantly. Once we hit the next stage of sales closure, however, there is the learning curve around how to classify Analytics (software? service? consulting?) and how to price it (by number of users? reports? templates? rows of data?). We spend a fair bit of time educating our enterprise customers and evolving our commercial models,” he adds.
Although bootstrapped, Gramener has been operationally profitable from the third year of its inception. “We have proven ourselves in the enterprise market with various customer accolades, analyst recommendations. We have devised value driven engagements models, GTM strategies scalable with partners and stickiness with our clients.”
Gramener is now looking to raise growth capital, and is having conversation with a few chosen partners, who can “enable our growth plans and be part of our growth story”.
Photo by Markus Spiske on Unsplash
The post This startup uses AI to convert complex data into memorable visual stories appeared first on e27.